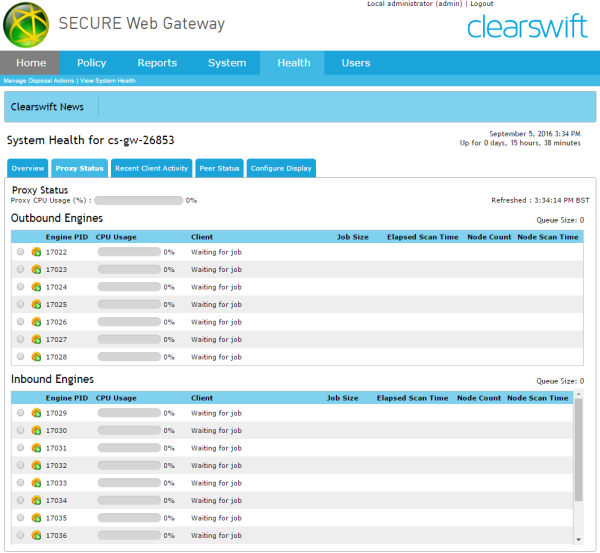
You can monitor the
From the Web
The page displays:
| Icon | State |
|---|---|

|
Engine idle and waiting for job |

|
Engine processing |

|
Engine restarting |
Other information displayed:
| Item | Description |
|---|---|
| Proxy CPU Usage (%) | Percentage of time where the CPU is processing instruction as opposed, for example, waiting for input and output operations. |
| Queue Size | The number of jobs that are waiting to be processed. |
| Engine PID | PID, or process identifier, is a number that is used to uniquely identify a process. |
| CPU Usage | Percentage of time where the CPU for the given PID is processing instruction as opposed, for example, waiting for input and output operations. |
| Client | The username and IP address of the client machine that has generated the job. |
| Job Size | The size of the job that is being processed, for example, the size of a file being downloaded. |
| Elapsed Scan Time | The total processing time for the given PID on this job. |
| Node Count | The number of nodes that have been processed so far for the request. |
| Node Scan Time | The time taken by processing the last node used in the request. |
| URL | The URL being processed by the engine. |
With the volume and variation of data that can be streamed through your
When a restart request is made, the specified content scanning engine will be terminated, and another engine will be started to take its place. Any existing transactions for the engine being restarted will be terminated.
An icon will display in the user interface against the engine being restarted, indicating progress of the restart. The restart event will be logged in the Web Proxy Event log.
| Depending on what an engine is processing when it is restarted, users might receive an error message in the browser. For example, if a file download is terminated, an HTTP 500 error message might be encountered. |
The information provided on this page can provide evidence of an engine that is stuck processing a transaction. For example, an engine with an unchanged node count, high node scan time, and a CPU usage that is at 0 or 100% consistently, is strong indicator than an engine is stuck.
Stuck engines might not always be due to problems with the proxy. For example, small queues or several idle engines could indicate a different problem.
|
As engines are displayed by processing time, any engines that are stuck are likely to be at the top of the list. |
If you think an engine is having difficultly processing a request, you can take a copy the URL for further investigation. To do this:
| You should use a different |
After the restart a dialog box will display the result of the request.